Introduction
CoMeT is a tool for concept design of compliant mechanisms. The software is designed to let a user quickly sketch an idea in a Matlab based GUI, then perform deformation, stress, optimization and sensitivity analyses of a concept. The tool is targeted to provide a bridge between rough back of the envelope calculations (short, order of magnitude analysis) and detailed FEA (time consuming, accurate analysis).
With this tool, designers can:
- Test feasibility of design concepts (without time needed to build a CAD/FEA model, mesh, post process, etc…)
- Obtain answers within 5 – 10 % of measured values
- Rapidly converge on an optimum
- Develop their engineering intuition about compliant mechanism
The CoMeT GUI is organized into five modules:
| Editor | Analyzer | Motion diagnosis |
Sensitivity | Optimizer | FAQ |
Editor:
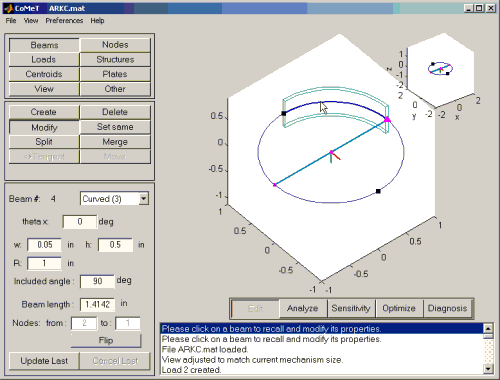
| Figure 1: CoMeT editor interface (user is drawing/defining a curved beam) |
The editor is similar to a basic CAD/drawing interface that emulates sketching by hand on paper. The user creates a CoMeT model by drawing the compliant mechanism concept by hand (via mouse), setting material properties, structural attributes (i.e. cross sections and taper angles) and boundary conditions. Available beam geometries are:
+ Rectangular
+ Round
+ Elliptical
+ Curved (single radius of curvature)
+ Tapered (single or double taper)
Within the editor, the user can also create, save, and retrieve files containing the mechanism geometry and parameters (material properties, boundary conditions, cross sections, etc..). The thumbnail in the corner gives an alternate view at all times, facilitating three dimensional drawing.
Analyzer:
| Editor | Analyzer | Motion diagnosis |
Sensitivity | Optimizer | FAQ |
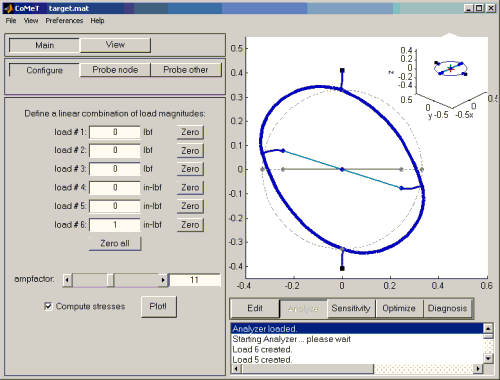
| Figure 2: CoMeT analyzer interface |
The analyzer plots the deformed response and presents analysis data. Figure 2 shows the analyzer interface in which a twisting moment (in the z-direction) is acting on a compliant ring. Moments/forces can be super imposed and plotted to view combined loading responses. Probing nodes, beams, loads, etc. brings up all the data associated with the current object and load state.
Motion
diagnosis tool:
|
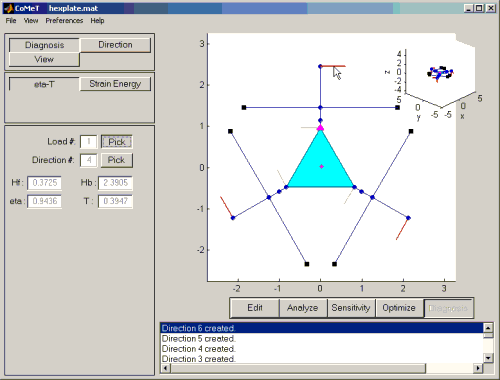
| Figure 3: CoMeT motion diagnosis – HexFlex compliant mechanism with loads (red) & fixed nodes (squares) |
The motion diagnosis tool performs analysis that may prove useful in mechanism design. Rigid mechanisms can be characterized by a transmission ratio, which determines the displacement reduction and force amplification from input to output, for a conservative system. In CoMeT, “T” is the intrinsic transmission ratio and “eta” is an efficiency factor that quantifies a system’s ability to reject disturbances at the output for a given transmission ratio.
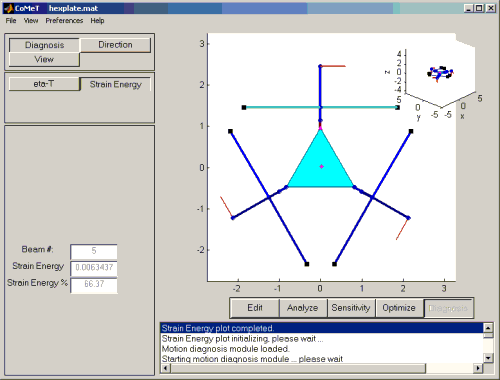
| Figure 4: CoMeT motion diagnosis – Stain energy analysis of HexFlex compliant mechanism |
The energy stored in the elastic components of a mechanism is an indication of which elements are most “active” and critical to system performance. In the case shown above, the short brown beam (top, middle) stores two thirds of the strain energy of the system when the upper beam is pushed to the left. It is also the first beam to fail and the most critical feature of the design.
Sensitivity
study:
| Editor | Analyzer | Motion diagnosis |
Sensitivity | Optimizer | FAQ |
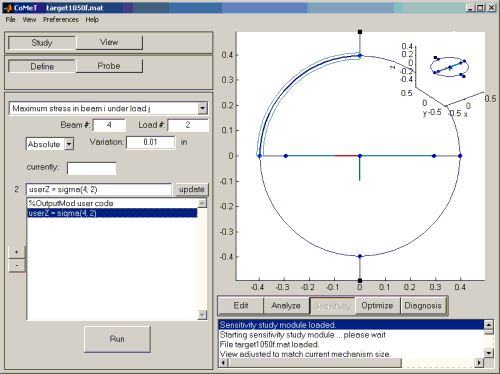
| Figure 5: CoMeT sensitivity study interface |
This module can be used to determine how sensitive a design variable is to mechanism geometry. CoMeT generates the partial derivative of the design variable with respect to each node coordinate and beam property. Sensitivity studies are useful in establishing manufacturing tolerances and suggesting conceptual design changes.
Optimizer:
| Editor | Analyzer | Motion diagnosis |
Sensitivity | Optimizer | FAQ |
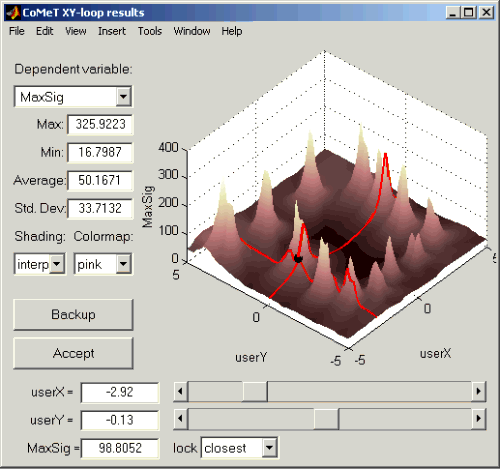
| Figure 6: CoMeT optimizer tools |
The optimizer is a powerful tool that may be used to find multivariate optima. Figure 6 shows graphical results of a two-variable optimization study. The surface plot shows how variable A (userZ = MaxSig or maximum stress in this example) changes with variables B (userX) and C (userY). Through this interface, designers can graphically render relationships that would be impractical to visualize/study in numerical form.
